Hi Andrea,
I cannot see your converter, so I cannot determine how you're applying the parameter. However, there is a simpler way to achieve the same display format. The one you're trying to use is the "General Short" format.
You can achieve by doing .ToString("g") on a TimeSpan object in the converter without passing a parameter.
Here's the new XAML:
And heres the converter:
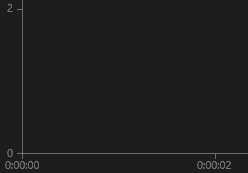
Here's what is looks like on the axis:
![]()
Now, I need to address your LinearAxis's Minimum and Maximum bindings. That converter returns a string, but you need to set a double value there, so it wont work as-is. You could write a separate converter that returns the max and min from the TimeSpan, but I recommend letting the Chart automatically do that for you.
Concerning the series type, I cannot see your model or any sample data, so I can only surmise what you want to plot. I do suspect that ScatterLineSeries is what you want based on your PropertyNameBindings.
Lastly, I do not see a VerticalAxis defined, the chart will not plot anything until that is set. I've updated your XAML to include all of what I mentioned above as well as a VerticalAxis.
If this still inst working for you, please respond with the following items:
- All your XAML code related to the Chart, including the missing AxisLineStyle and AxisLabelStyle (please do not include HTML in your XAML)
- The TimeSpanFormatConverter converter
- The model you're using (what is RRCollection a list of?)
- A sample of what RRCollection contains and the full (please make sure you do not have any HTML in it)
Another faster option that you can take is to put together a small sample that reproduces the problem and open a ticket here and attached the demo (this is the fastest option because support tickets have a 24hr response time, while forums can take up to 72 hours).
Regards,
Lance | Tech Support Engineer, Sr.
Telerik by Progress
I cannot see your converter, so I cannot determine how you're applying the parameter. However, there is a simpler way to achieve the same display format. The one you're trying to use is the "General Short" format.
You can achieve by doing .ToString("g") on a TimeSpan object in the converter without passing a parameter.
Here's the new XAML:
<telerikChart:LinearAxis.LabelTemplate> <DataTemplate> <TextBlock Text="{Binding Converter={StaticResource TimeSpanFormatConverter}}" /> </DataTemplate></telerikChart:LinearAxis.LabelTemplate>And heres the converter:
public object Convert(object value, Type targetType, object parameter, string language){ double seconds = System.Convert.ToDouble(value); TimeSpan timeSpan = TimeSpan.FromSeconds(seconds); return timeSpan.ToString("g");}Here's what is looks like on the axis:
Now, I need to address your LinearAxis's Minimum and Maximum bindings. That converter returns a string, but you need to set a double value there, so it wont work as-is. You could write a separate converter that returns the max and min from the TimeSpan, but I recommend letting the Chart automatically do that for you.
Concerning the series type, I cannot see your model or any sample data, so I can only surmise what you want to plot. I do suspect that ScatterLineSeries is what you want based on your PropertyNameBindings.
Lastly, I do not see a VerticalAxis defined, the chart will not plot anything until that is set. I've updated your XAML to include all of what I mentioned above as well as a VerticalAxis.
<telerikChart:RadCartesianChart> <telerikChart:ScatterLineSeries ItemsSource="{Binding RRCollection}"> <telerikChart:ScatterLineSeries.VerticalAxis> <telerikChart:LinearAxis /> </telerikChart:ScatterLineSeries.VerticalAxis> <telerikChart:ScatterLineSeries.HorizontalAxis> <telerikChart:LinearAxis ShowLabels="True"> <telerikChart:LinearAxis.LabelTemplate> <DataTemplate> <TextBlock Text="{Binding Converter={StaticResource TimeSpanFormatConverter}}" /> </DataTemplate> </telerikChart:LinearAxis.LabelTemplate> </telerikChart:LinearAxis> </telerikChart:ScatterLineSeries.HorizontalAxis> <telerikChart:ScatterLineSeries.XValueBinding> <telerikChart:PropertyNameDataPointBinding PropertyName="Duration" /> </telerikChart:ScatterLineSeries.XValueBinding> <telerikChart:ScatterLineSeries.YValueBinding> <telerikChart:PropertyNameDataPointBinding PropertyName="YValue" /> </telerikChart:ScatterLineSeries.YValueBinding> <telerikChart:ScatterLineSeries.PointTemplate> <DataTemplate> <Ellipse Width="5" Height="5" Fill="{Binding DataItem.Brush}" /> </DataTemplate> </telerikChart:ScatterLineSeries.PointTemplate> </telerikChart:ScatterLineSeries></telerikChart:RadCartesianChart>If this still inst working for you, please respond with the following items:
- All your XAML code related to the Chart, including the missing AxisLineStyle and AxisLabelStyle (please do not include HTML in your XAML)
- The TimeSpanFormatConverter converter
- The model you're using (what is RRCollection a list of?)
- A sample of what RRCollection contains and the full (please make sure you do not have any HTML in it)
Another faster option that you can take is to put together a small sample that reproduces the problem and open a ticket here and attached the demo (this is the fastest option because support tickets have a 24hr response time, while forums can take up to 72 hours).
Regards,
Lance | Tech Support Engineer, Sr.
Telerik by Progress
Do you want to have your say when we set our development plans?
Do you want to know when a feature you care about is added or when a bug fixed?
Explore the
Telerik Feedback Portal
and vote to affect the priority of the items


